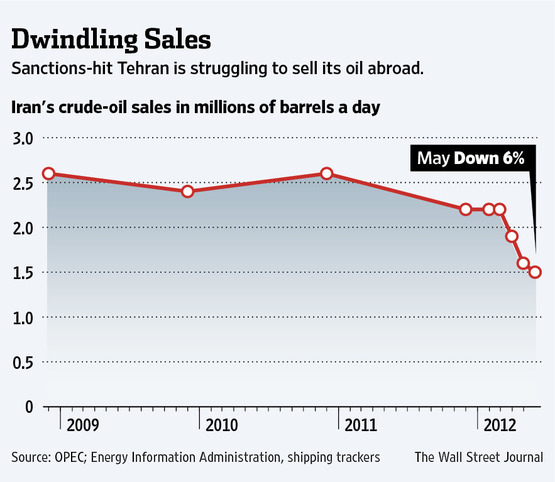
Chart of the Day: the oil sanctions are working on Iran
 Friday, July 13, 2012 at 10:17AM
  Arguably the primary reason why Israel holds off attacking - that and its modest satisfaction with the success of the combination strategy of cyber warfare attacks and assassinations of technical personnel.
You can see that the sanctions have taken about a million barrels a day - or about 40% of daily production denied in terms of sales.
That is significant - and a genuine success for Obama.
The hottest subject in oil deals today involves anybody who has been a regular buyer of Iran. All of these states are looking to replace - now.
And no, they don't all go running to the Saudis.
This chart is a month old. More recent news says roughly 50% drop in May-June alone. Not sure I buy that. Lots of desperate deals happening out there involving Iran. But clearly, the trend is downward and steep.
I honestly do believe that the Arab Spring is helping plenty. With Syria on the ropes, the anti-Iran long knives are out.


Reader Comments (1)
I enjoyed your write-up and the graph, but I disagree that this represents a "genuine success" for Pres. Obama. His administration stopped the Bush sanctions escalation process that was underway when Obama took office, and he attempted diplomacy with Iran from January 2009 up until July 2010. This year and a half gave Iran key breathing room it needed to develop its nuclear program.
Furthermore, the Obama administration was reluctant to sanction the Iranian oil sector due to concerns about global oil supply and the effect on oil prices. They opted for targeted sanctions of IRGC and its front companies instead from 2010 to 2011. Europe was actually more forward leaning on this point than the U.S.
Overall we have seen a sluggish escalation of sanctions. And even though sanctions may have helped devalue the Iranian rial and reduce their oil output, Iran's official's are still able to transfer money in their budget from lower priority items to their higher priority nuclear pursuits.