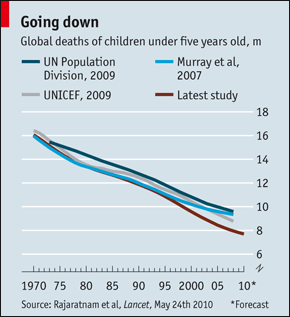
Chart of the day: under-five global deaths since 1970
 Friday, June 18, 2010 at 12:01AM
  Economist article on public health citing what one Aussie expert calls "undoubtedly the biggest advance in mortality measurement in four decades!"
This guy, Alan Lopez of Queensland U, presented a study on infant death trends in Washington in late May (later published by Lancet), and the Economist readily excused his hyperbole, because it's a stunning trend.
As the Economist chart showed, everybody was tracking the incredible decline over the past four decades. What Lopez's work showed was that they were all underestimating the drop.
Setting aside methodological controversies that naturally ensue, along with the fear of charities that such revisions rob them of donations, the real point of this chart is the overwhelming agreement on the curve, with only minor disagreements (to the layman, that is) regarding degrees of steepness.
You want to sell me that crap that says globalization is bad for the weakest and the poorest on this planet? Well, infant mortality is a great measure, and there seems to be an amazing correlation between globalization's explosive spread since the early 1970s (when this globalized world was truly born) and the cutting in half--in absolute terms--of infant mortality globally--EVEN AS THE WORLD POPULATION ALMOST DOUBLED FROM 3.6B TO 6.6B!
So factoring in the population growth, babies today are really roughly four times more likely to make to five than those born in 1970.
Put that in your pipe and smoke it.
 demographics,
  global trends,
  healthcare | in
  Chart of the day |
  Email Article |
  Permalink |
  Print Article


Reader Comments (1)
Since the base of the chart is baby deaths, your last statement should read "... babies today are really roughly one quarter as likely to die before five than those born in 1970." To convert this insight to likely-to-make-it-to-five, one must not simply invert the 1/4 but must adjust for the much larger base of births that is not included in the chart. When that adjustment is made, the four times more likely gets diluted to a few percent more likely. Of course, still a substantial achievement.