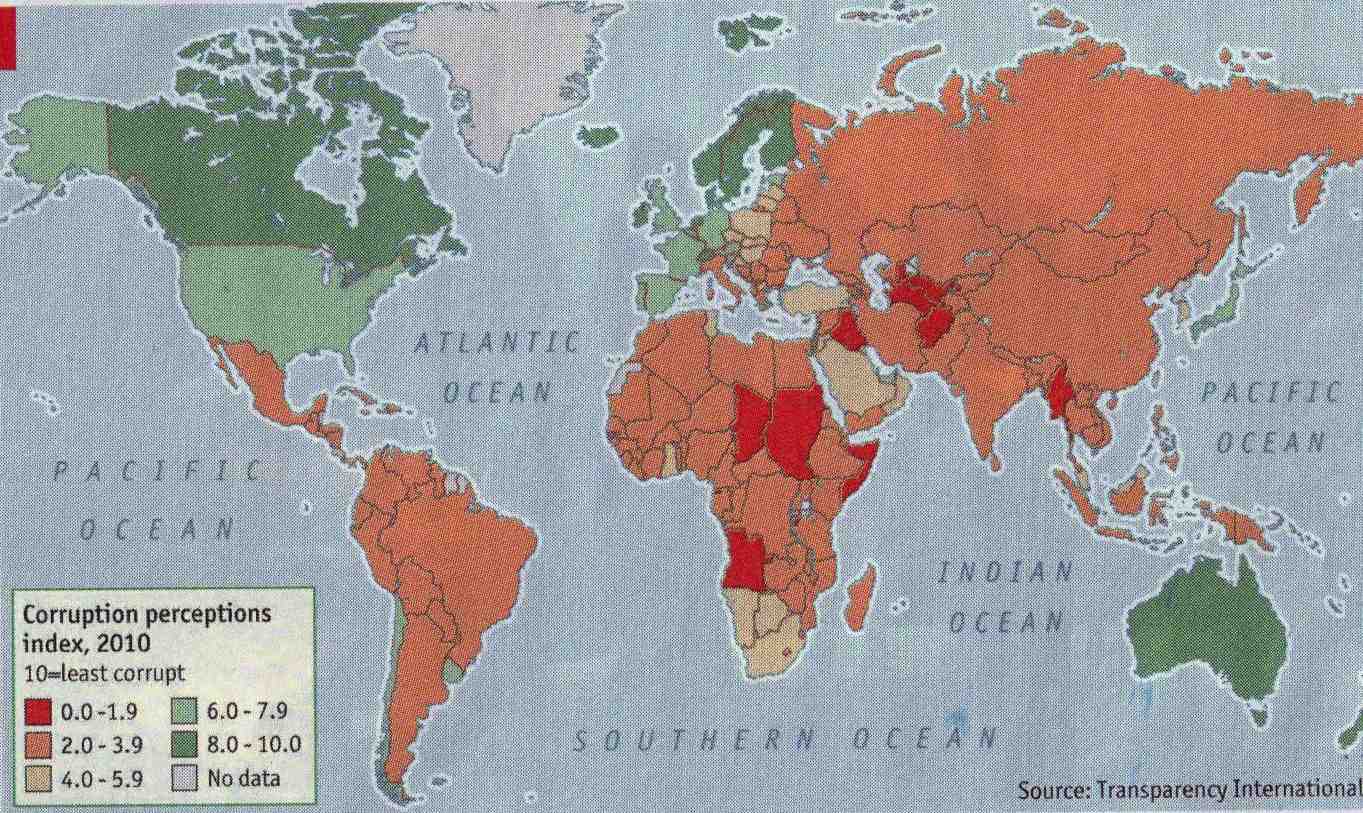
Interesting map from Economist based on Transparency International's annual corruption perceptions index.
The usual Core-Gap breakdown:
- Other than Core island Israel, basically all least-corrupt countries are Old Core west and east.
- The middling countries are either neighbors to Old Core (EE) or New Core (South Africa) and its neighbors. Exception is oil-rich PG majors inside the Gap.
- Virtually all of the New Core are considered somewhat corrupt. No surprise, these are booming places and boomers tend to have their share of corruption.
- All the truly bad situations are Gap countries.
Typical of the map and my biases over the years, much of Africa surprises by not being too bad. If there is one great mistake I've made on trends analysis, it's been to underestimate Africa's potential for positive change.